An initiative portfolio the PMO can plan and prioritise
Programmes and initiatives in one model-driven app, with a priority index, capacity planning, delay-risk prediction and weekly reports that write themselves.
Example project
Based on a project our team built. Client details are left out or changed, and the demo uses invented data.
- Sector
- Large service company, PMO
- Typical duration
- 12 to 20 weeks
Typical client situation
The PMO of a large service company coordinates dozens of initiatives across operations, finance and client programmes. Every quarter it has to decide which initiatives go ahead, and every unit wants its own.
Challenge
Projects live in spreadsheets and slide decks. Codes are assigned by hand, statuses differ between files, and nobody can say how long a project has been on hold or why it was replanned.
Quarterly planning is a negotiation by email. Without a shared score, the loudest department wins, and responses from each department arrive in different formats and are easy to lose.
Solution
We design a model-driven app on Dataverse with about 27 tables and a set of Power Automate flows. A Programme, Initiative and Activity hierarchy gets automatic codes such as PG-OPS / IN-26-103, and initiatives move through Intake, Shaping, Delivery, Paused, Closed and Dropped, guided by a business process flow from Intake to Handover.
Each initiative gets a priority index, business value minus risk, and the indexes build the longlist, shortlist and committed list for each quarterly planning period. Units answer on the initiative record, replan records count the days paused, and team assignments and lessons learned stay with the initiative. A roadmap by quarter shows the committed work, and a leave calendar runs as a companion app on the same data.
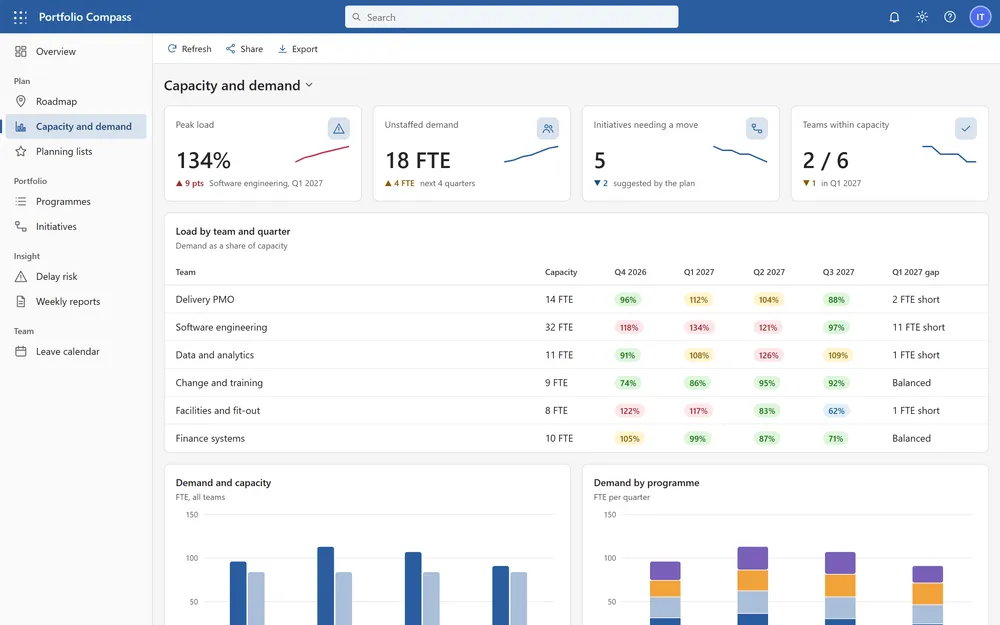
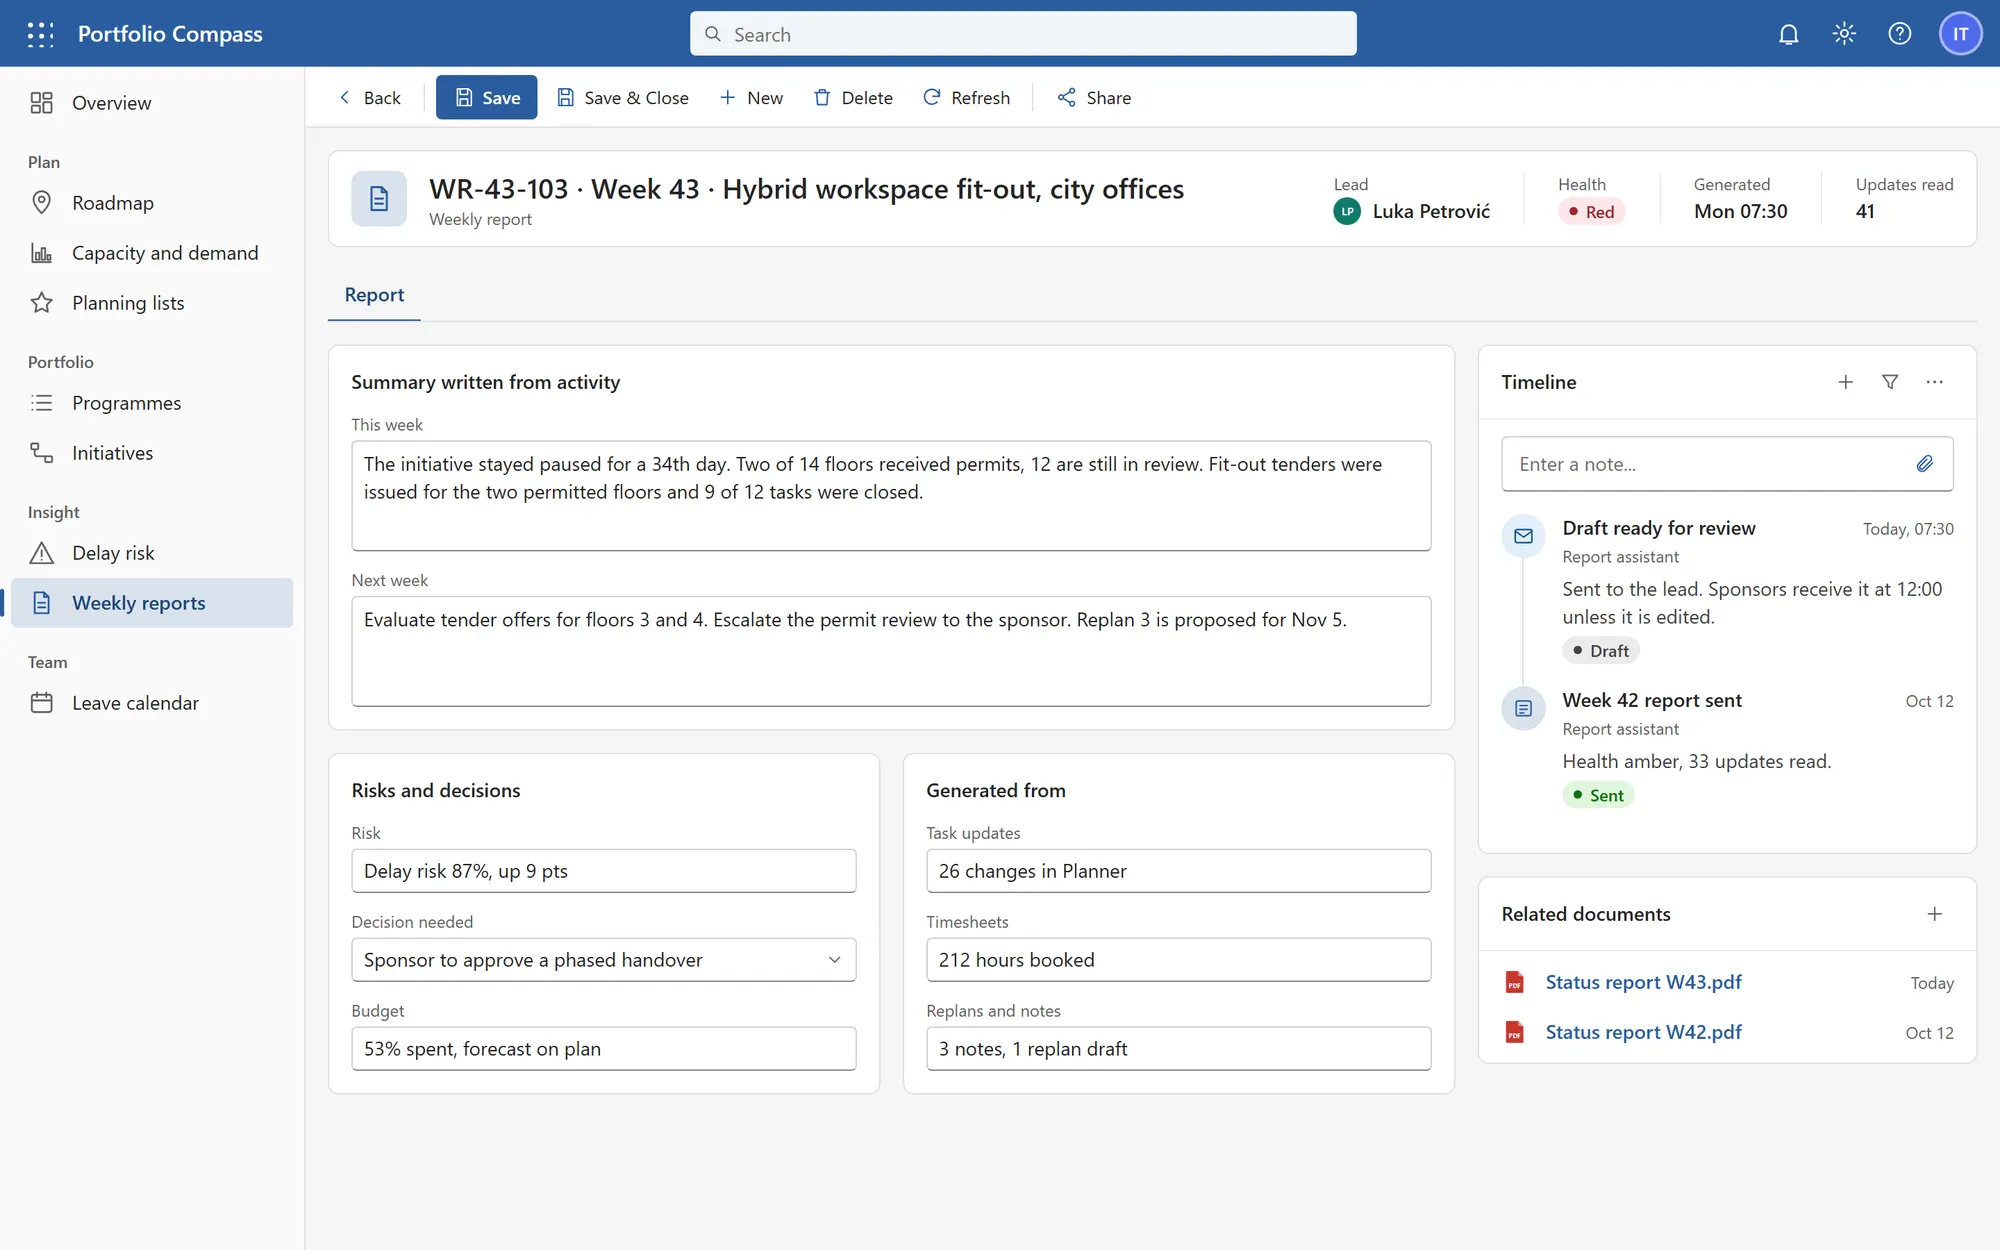
A capacity and demand heat map compares the load of each team with its capacity for the next four quarters and shows where the plan needs a move. A prediction model scores the delay risk of every initiative every morning from replans, pauses, open decisions and team load, and lists the reasons and a suggested action. Every Monday the solution writes a weekly status report for each initiative from task, timesheet and note activity, ready for the lead to review.
Programme, Initiative and Activity hierarchy with automatic codes
Priority index from business value and risk, feeding quarterly lists
Capacity heat map by team and quarter, with the gap in FTE
Delay-risk prediction for every initiative, with the reasons and a suggested action
Weekly status reports written from task, timesheet and note activity
Roadmap by quarter and replan records that count the days paused
Stack
- Power Apps (model-driven)
- Dataverse
- Power Automate
- Power BI
- Plugins in C#
- Microsoft Entra ID
Screens from the demo
We rebuilt this solution as a demo with invented data, so you can see how it works without exposing any client system. Click through it yourself.
Open the interactive demo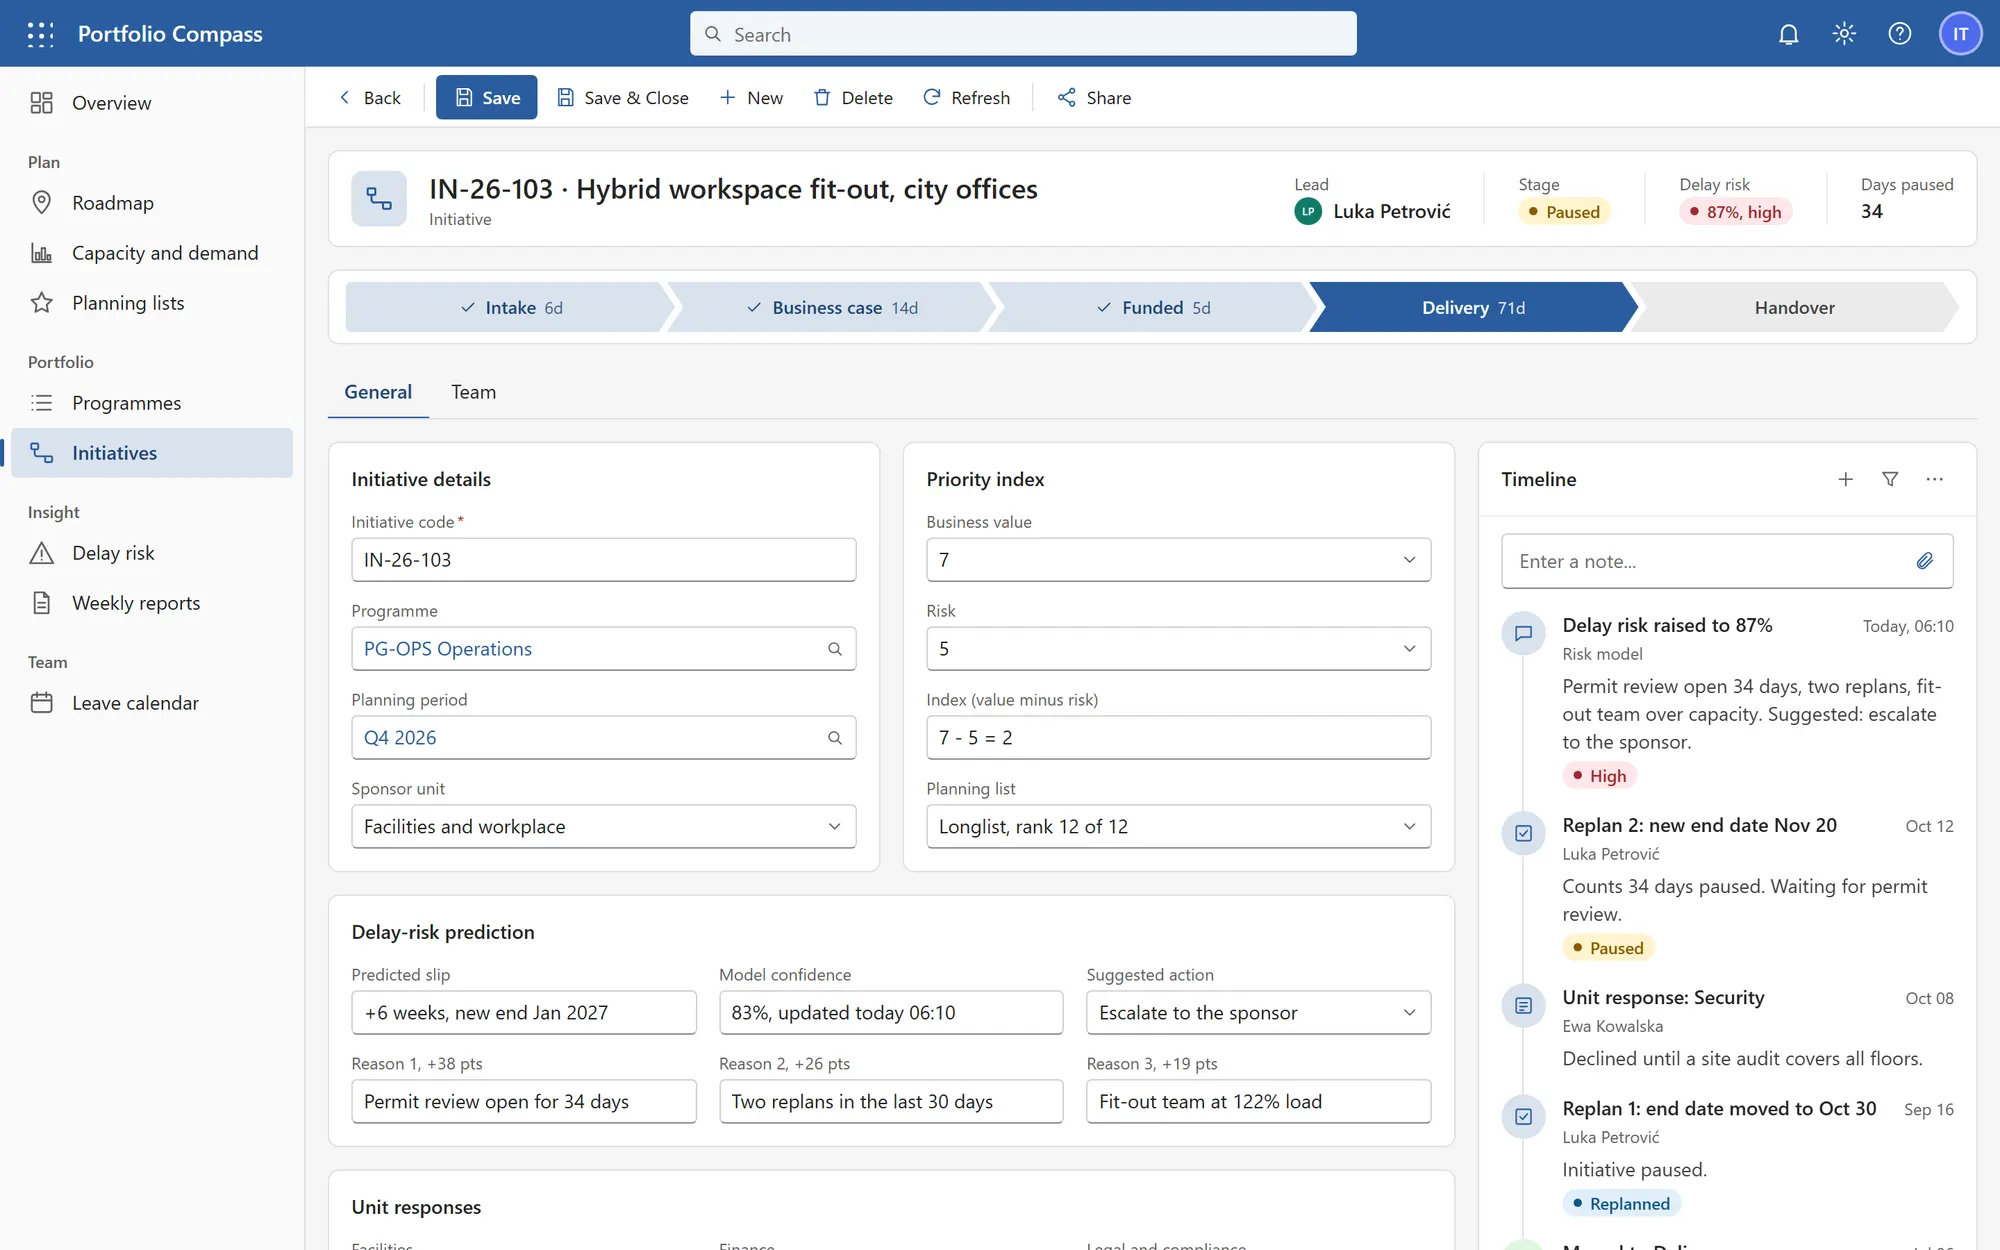
What it is built to deliver
- with the same codes and stages for everyone
- One portfolio
- demand against capacity, team by team
- Load visible
- early, with reasons and a suggested action
- Risks flagged
Recognize the situation?
Tell us where your process is stuck. We will tell you honestly whether we can help.